The local prices are expected to be released soon, stay tuned!
Got it
+86 021 5155-0306
Language:
SMM
Sign In
Base Metals
Aluminum
Copper
Lead
Nickel
Tin
Zinc
New Energy
Solar
Lithium
Cobalt
Lithium Battery Cathode Material
Anode Materials
Diaphragm
Electrolyte
Lithium-ion Battery
Sodium-ion Battery
Used Lithium-ion Battery
Hydrogen Energy
Energy Storage
Minor Metals
Silicon
Magnesium
Titanium
Bismuth/Selenium/Tellurium
Tungsten
Antimony
Chromium
Manganese
Indium/Germanium/Gallium
Niobium/Tantalum
Other Minor Metals
Precious Metals
Rare Earth
Gold
Silver
Palladium
Platinum/Ruthenium
Rhodium
Iridium
Scrap Metals
Copper Scrap
Aluminum Scrap
Tin Scrap
Ferrous Metals
Iron Ore Price
Finished Steel
Coke
Coal
Pig Iron
Silicon Steel
Others
Futures
SMM Index
MMi
February 28 Inventory and Port Pick-Up Volume of 35 Ports
Feb 28, 2025, at 3:07 am
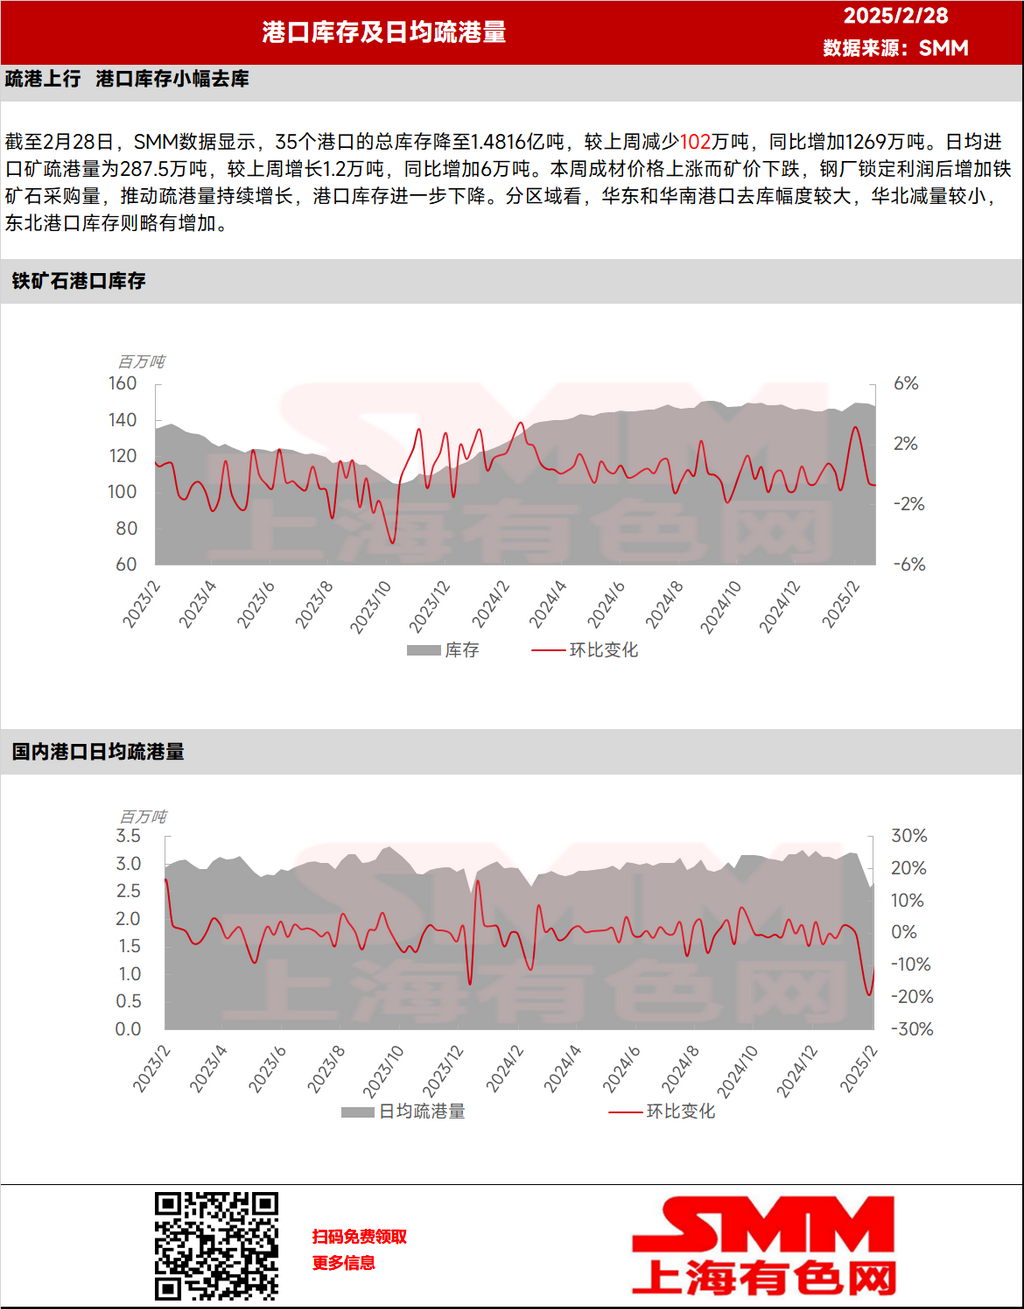
As of February 28, SMM data showed that the total inventory at 35 ports dropped to 148.16 million mt, down 1.02 million mt WoW and up 12.69 million mt YoY. The daily average port pick-up volume of imported ore was 2.875 million mt, up 12,000 mt WoW and up 60,000 mt YoY. This week, finished steel prices rose while ore prices fell. After locking in profits, steel mills increased their iron ore procurement volume, driving a continuous rise in port pick-up volume and further reducing port inventories. By region, east and south China ports saw significant destocking, while the reduction in north China was relatively small, and inventories at north-east China ports slightly increased.
As of February 28, SMM data showed that the total inventory at 35 ports dropped to 148.16 million mt, down 1.02 million mt WoW, up 12.69 million mt YoY. The daily port pick-up volume of imported ore reached 2.875 million mt, up 12,000 mt WoW, up 60,000 mt YoY. This week, finished steel prices rose while ore prices fell. After locking in profits, steel mills increased their iron ore procurement volume, driving a continuous rise in port pick-up volume and further reducing port inventories. By region, east and south China ports saw significant destocking, north China experienced a relatively small decrease, while north-east China ports recorded a slight inventory increase.