For supply conditions, please refer to the previous article~
- Steel Demand in Thailand
From the perspective of finished steel consumption structure, in 2023, Thailand's flat steel consumption was 10.1 million mt, and long steel consumption was 6.2 million mt, accounting for 62% and 38% of total demand, respectively. Due to construction activities, domestic steel demand is expected to grow by 1.1% YoY in 2025.
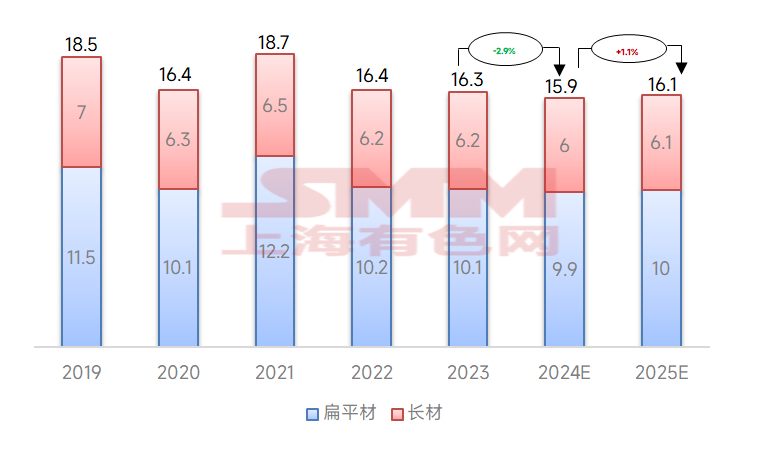
Figure 7 - Thailand's Steel Demand by Product Type Over the Past 7 Years (Million mt)
Data Source: ISIT, SMM
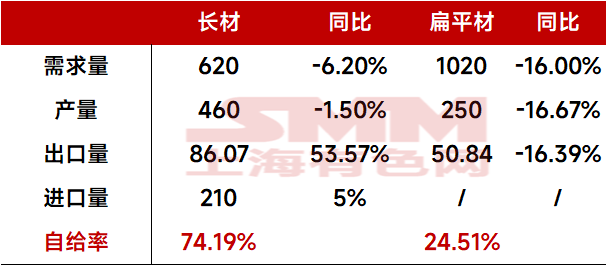
Specifically, Thailand has a relatively high self-sufficiency rate for long steel, while flat steel relies more on imports. The self-sufficiency rate for long steel reached 74.19%, while that for flat steel was only 24.51%.
Table 2 - Thailand's Self-Sufficiency in Flat and Long Steel in 2022 (10,000 mt)
In January 2025, due to increased demand for flat and long steel, Thailand's finished steel consumption rose. According to the Iron and Steel Institute of Thailand (ISIT), Thailand consumed 1.45 million mt of finished steel in January, up 2% YoY. Among them, flat steel demand increased by 1.9% to 893,920 mt, while long steel demand rose by 2.3% YoY to 550,910 mt. It is understood that most types of steel consumption showed an upward trend, while a few products showed a decline. These products include wire rod (down 14.9% YoY), hot-rolled sheet (down 5.3% YoY), and galvanized sheet (down 7.3% YoY).
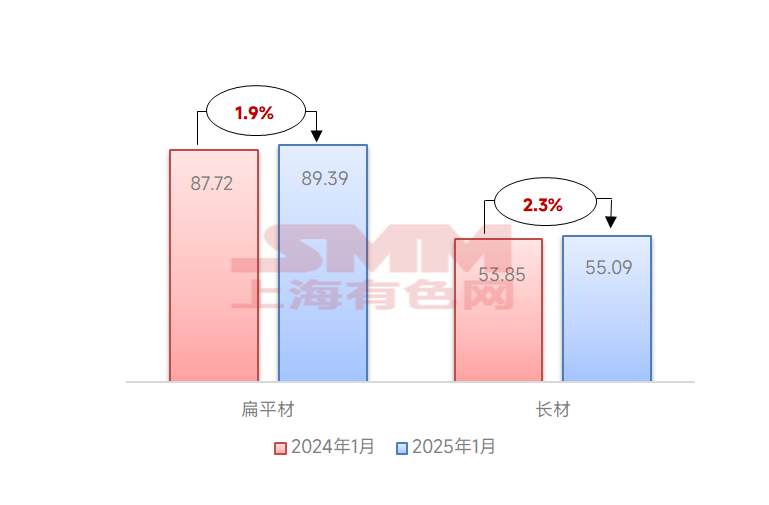
Figure 8 - Thailand's Flat and Long Steel Demand in January 2025 (10,000 mt)
Data Source: ISIT, SMM
According to data from the Southeast Asia Iron and Steel Institute, Thailand's main end-user sectors are primarily the construction market, accounting for about 60%, while manufacturing industries such as automotive, electrical appliances, and machinery equipment account for about 40%.
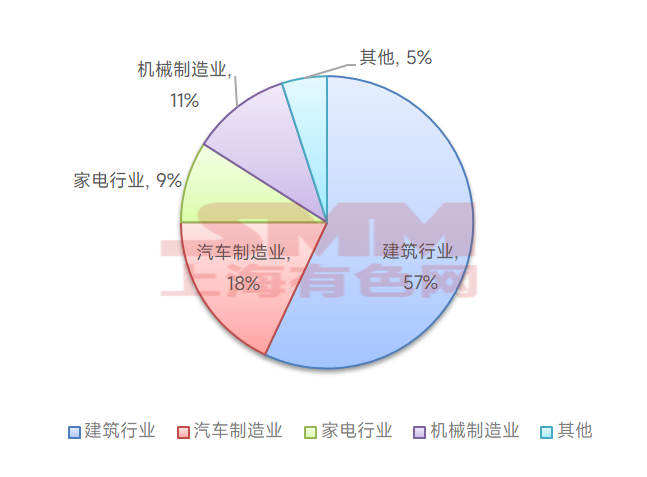
Figure 9 - Thailand's Steel Consumption by Industry
Data Source: ISIT, SMM
Thailand's construction industry is expected to show mild growth in the coming years. Benefiting from the development of the construction industry, Thailand's steel demand is also expected to grow steadily. Additionally, steel consumption in the automotive industry accounts for 17% of Thailand's total steel consumption. Under the "Thailand 4.0 Vision," the automotive industry is one of the five key industrial sectors, and it is expected to become an important source of steel demand growth in the future.
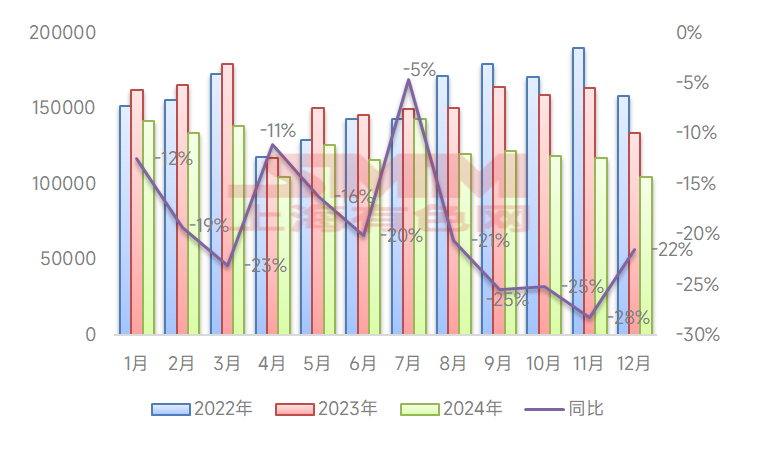
Figure 10 - Thailand's Automotive Production Data, 2022-2024
Data Source: Federation of Thai Industries, SMM
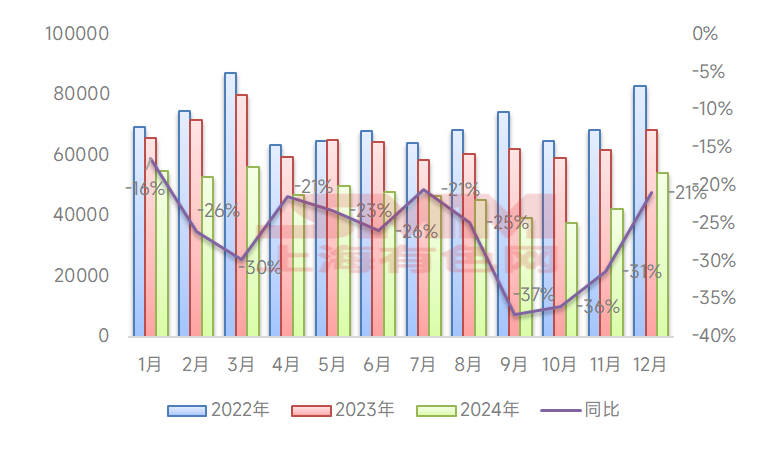
Figure 11 - Thailand's Automotive Sales Data, 2022-2024
Data Source: Federation of Thai Industries, SMM
Based on data from national statistical offices and customs websites, per capita crude steel consumption in Southeast Asia is approximately 110 kg/person. Malaysia, Vietnam, and Thailand have relatively high per capita consumption levels, exceeding 200 kg/person, with the figure reaching 242 kg in 2023. Worada Jangbangsakae, an industry analyst at the Iron and Steel Institute of Thailand, predicts that Thailand's apparent steel consumption will grow by 1.9% YoY in 2025, reaching 16.64 million mt.
- Thailand's Steel Import and Export Situation
- Imports
Thailand lacks large integrated steel enterprises, and domestic capacity growth is limited. Each year, a significant amount of steel products must be imported to meet the needs of domestic industries such as construction and machinery manufacturing. From 2023 to 2024, annual imports exceeded 10 million mt.
In December 2024, Thailand's steel import value reached $975 million, up 22.64% YoY. From January to December 2024, the total steel import value was $10.975 billion, down 5.5% YoY. In December 2024, Thailand's steel import volume reached 1.297 million mt, up 57.02% YoY. From January to December 2024, the total steel import volume was 11.3454 million mt, down 6.66% YoY.
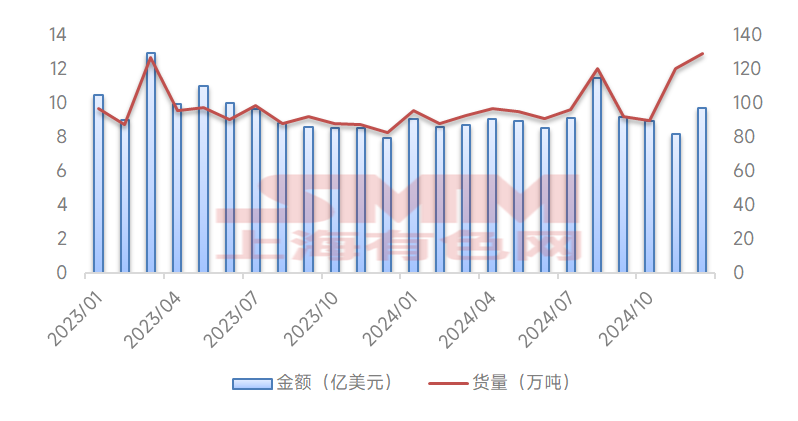
Figure 12 - Monthly Trends of Thailand's Steel Import Value and Volume, 2023-2024
Data Source: Thai Customs Department, SMM
In terms of import origins, the top 5 trading partners for Thailand's steel import value in 2024 were China, Japan, South Korea, Taiwan, China, and Indonesia. The top 5 trading partners for import volume were China, Japan, South Korea, Taiwan, China, and Malaysia.
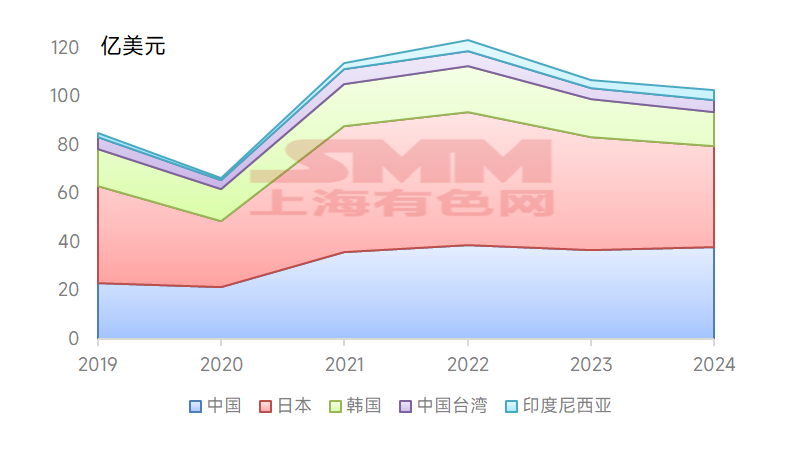
Figure 13 - Thailand's Top 5 Trading Partners for Steel Import Value and Historical Trends (Billion USD)
Data Source: Thai Customs Department, SMM
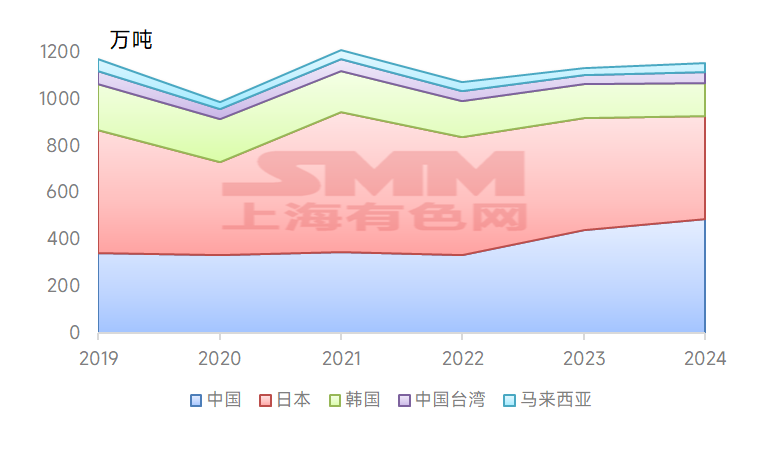
Figure 14 - Thailand's Top 5 Trading Partners for Steel Import Volume and Historical Trends (10,000 mt)
Data Source: Thai Customs Department, SMM
In terms of imported product types, the most imported product in 2024 was sheets & plates, with a total import volume of 8.21 million mt, accounting for 68% of total imports. This was followed by bars, with 2.08 million mt, accounting for 17%, and wire rod, with 270,000 mt, accounting for 2%.
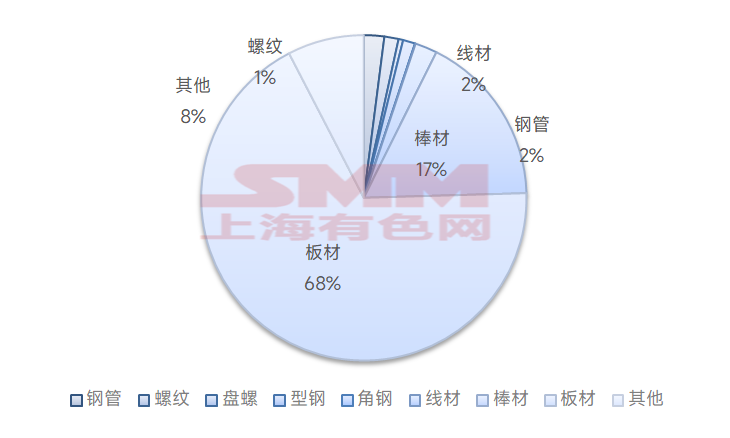
Figure 15 - Thailand's Steel Import by Product Type
Data Source: Thai Customs Department, SMM
- Exports
In December 2024, Thailand's steel export value was $140 million, up 12.72% YoY. From January to December 2024, the total steel export value was $1.742 billion, up 12.65% YoY. In December 2024, Thailand's steel export volume reached 232,400 mt, up 74.13% YoY. From January to December 2024, the total steel export volume was 1.8102 million mt, up 11.40% YoY.
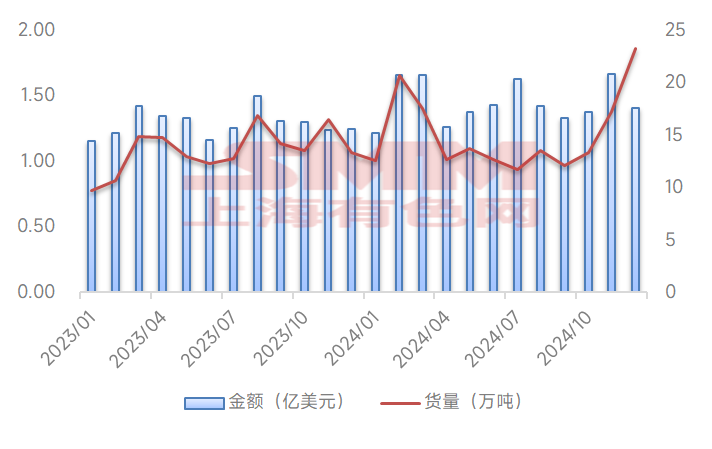
Figure 16 - Monthly Trends of Thailand's Steel Export Value and Volume, 2023-2024
Data Source: Thai Customs Department, SMM
In terms of export destinations, the top 7 trading partners for Thailand's steel export value in 2024 were India, South Korea, Malaysia, Indonesia, the US, Laos, and Vietnam. The top 7 trading partners for export volume were India, Malaysia, Vietnam, Myanmar, the Philippines, South Korea, and Laos.
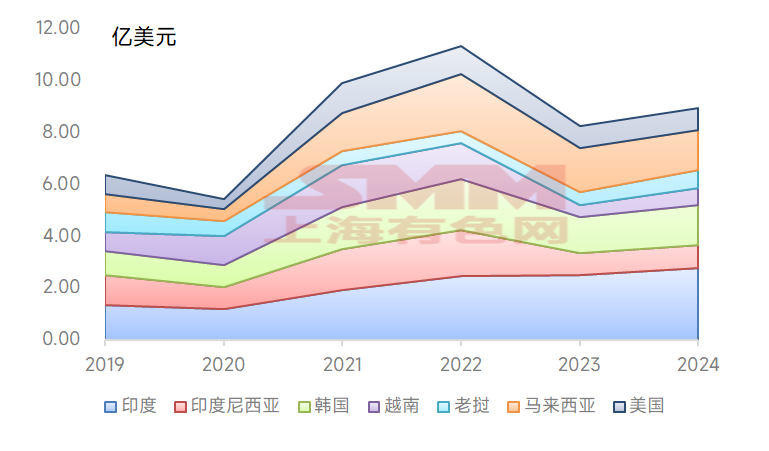
Figure 17 - Thailand's Top 7 Trading Partners for Steel Export Value and Historical Trends (Billion USD)
Data Source: Thai Customs Department, SMM
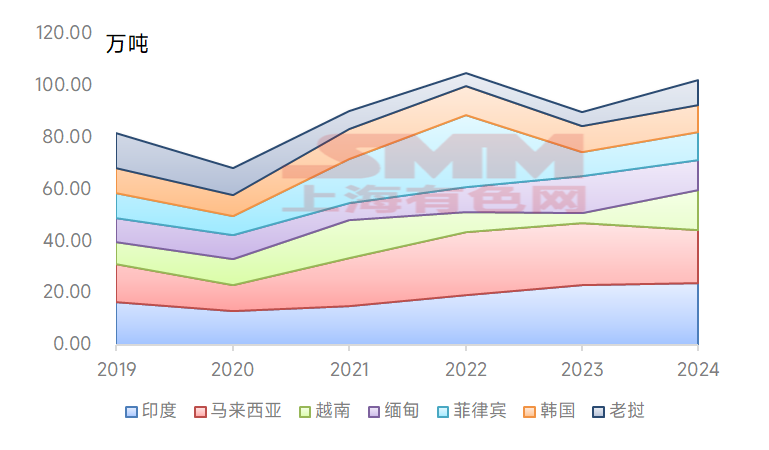
Figure 18 - Thailand's Top 7 Trading Partners for Steel Export Volume and Historical Trends (10,000 mt)
Data Source: Thai Customs Department, SMM
In terms of exported product types, Thailand's steel product export scale is relatively small, with export volumes relatively balanced across product types. In 2024, the most exported product was bars, with a total export volume of 380,000 mt, accounting for 21% of total exports. This was followed by angle steel, with 320,000 mt, accounting for 18%, and steel pipes and rebar, each with 320,000 mt, each accounting for 17%.
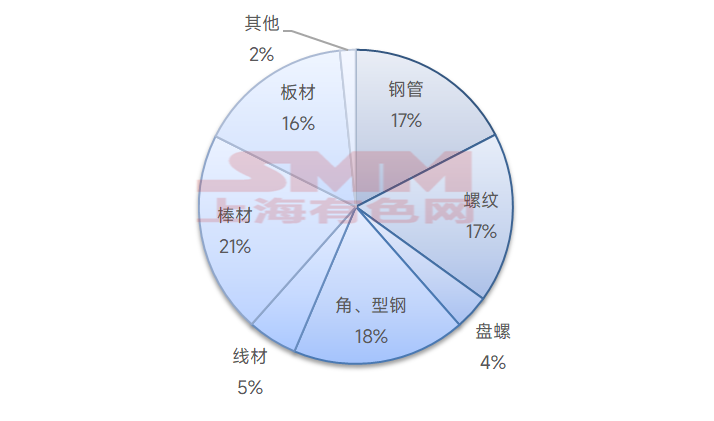
Figure 19 - Thailand's Steel Export by Product Type
Data Source: Thai Customs Department, SMM
- Summary
According to a survey by the World Steel Association (WSA), the main reasons for Thailand's consistently low steel capacity utilisation rate are related to the reliability, efficiency, and cost of steel mill production. In 2024, Thailand's local steel capacity utilisation rate was less than 30%, necessitating significant imports to meet domestic steel demand, keeping the country in a net import position. Meanwhile, Thailand's per capita crude steel consumption remains at a relatively low absolute level, indicating significant growth potential. However, local crude steel capacity utilisation remains low. Additionally, in January 2025, the Thailand Board of Investment (BOI) released the latest investment promotion catalog, which eliminated eligibility for new projects for long and flat steel products. Only existing projects meeting smart and sustainable industrial standards are eligible for investment incentives, and the incentive level has been uniformly downgraded from A4 or B in the old catalog to B. This reflects the difficulty of increasing new steel capacity. Therefore, despite initiating some anti-dumping investigations, Thailand's status as a net importer is unlikely to change in the short term!
SMM provides real-time tracking of steel import and export news. For more information, please follow the SMM official account!